School-level spending data, what does it really tell us?

School Spending in Missouri
This past week, DESE released the first-ever school-level per-pupil expenditure data. Historically, we’ve only ever seen these data aggregated to the district level. But, changes to federal data reporting requires that states now publicly report per-student spending by district and by school.
As available data become more fine-grained and nuanced, we can gain more insight into how schools are doing and where we might be better suited to allocate our resources. That being said, while there are more data, we don’t always get all that we want. While we had hoped there might be more meaningful insights into how spending varies within and across districts, we see, at best, weak relationships between school-level spending and things like student demographics, achievement, and growth. Let’s take a look and talk about what we can learn here.
What do we already know about spending in Missouri districts?
If you recall, we’ve already taken a look at how spending at the district level varies by student and school characteristics. We saw that the lowest-achieving districts spent an average of roughly $500 more per student than the highest achieving districts during the 2017-18 school year. Similarly, the smallest districts, those serving more non-white students, and districts with the largest populations of students in poverty spent the most. Unsurprisingly, these districts also exhibited the lowest achievement levels during the 2017-18 school year.
Here at the PRiME Center, we put more stock in growth over achievement, as students' socioeconomic advantages and disadvantages heavily impact point-in-time measures like Proficiency. Now that we have both school-level spending and growth, we can take a look at some of the relationships between dollars spent and students’ academic gains. For this piece, we are looking at data from the 2018-19 school year. While we focus on the school-level, we exclude special education schools, gifted and talented schools, and schools that provide alternative learning environments. These schools often serve small and specialized populations, making them outliers that can skew the data.
How does spending vary by school characteristics?
One of the most expensive costs a school and district face is personnel. Figure 1 below shows how school-level spending varies by average instructional costs, as measured by the average teacher salary in schools. Generally, we see a weak, positive relationship between school spending and average teacher salary.

Along with personnel costs, we can see that spending varies by the types of students schools serve. Generally, this relationship is stronger than that of spending and personnel costs. We observe that schools with a majority White student body spend less than more diverse schools. We see basically the inverse relationship among schools serving higher percentages of Black students.

Along with variation in spending by race, we see that schools with higher percentages of Free/Reduced-Price Lunch (FRL)-eligible students spend more than schools with higher percentages of affluent students. This is essentially the same result as the percentage of Black students served, as there is a strong relationship between the percentage of Black students and FRL-eligible students served.

In the figures below, we show the relationship between students’ academic outcomes and school spending. Generally, we see there is essentially no relationship between spending and academic growth and a very weak, negative relationship between school spending and achievement.
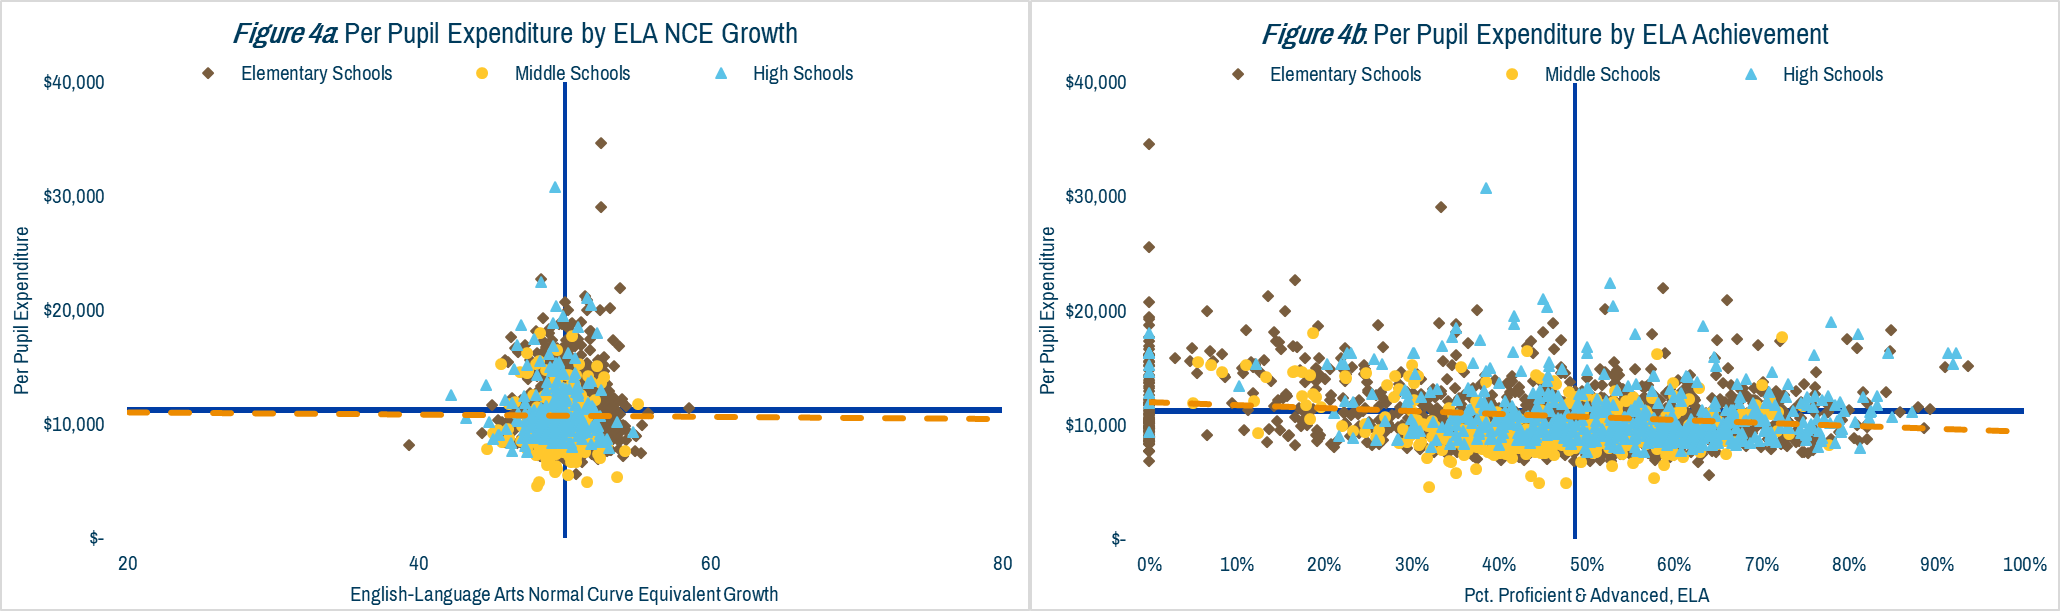
In these figures, schools in the top left quadrant are those that spend more and exhibit below-average expected growth or achievement, whereas those schools in the bottom right would be those with above-average growth or achievement and below-average spending.

Finally, we take a look at how much spending tends to vary within districts. Here we look at spending ranges in the ten largest districts in the state, as these have the most school sites. For the most part, we see little variation in how much money individual schools spend within a district, especially when we exclude specialized gifted and talented, special education, and other alternative learning environments. However, larger districts that serve a more diverse student body or serve more FRL-eligible students do show a broader range in school-level spending.

What does all this mean?
It’s important to remember that these are just descriptive results. All we are showing is a description of school spending and how it relates to things like school personnel costs, student characteristics, and student achievement and growth. This is not to say that spending more money causes less academic growth or will create a less diverse student body. Rather, what we are showing is that spending varies dramatically based on multiple factors within a school and district, and there are a whole host of things influencing student outcomes beyond just the amount of money spent. Additionally, while we know how much schools are spending, we still do not know how they are spending the money. We’ll be diving deeper into these spending questions over the next few months and are excited that more data are available to make evidence-informed decisions.
MORE FROM THE PRiME BLOGS


A new report estimates that more than 3.4 million children in America are homeschooled – signaling yet again that the post-COVID homeschool surge is here to stay.