Education in the Missouri Bootheel
By: Evan Rhinesmith, Ph.D.
Published On: June 20, 2019

Image c/o https://commons.wikimedia.org/wiki/User:BrineStans
Today, we’re releasing our first Bootheel Regional Profile. For those who are unaware, the Bootheel is one of the most impoverished regions of the state and lies in the very southeast corner. Inside, you’ll find a description of the students, funding, and performance of traditional public (TPS) school districts in Dunklin, Mississippi, New Madrid, Pemiscot, Scott, and Stoddard Counties. Across these six counties, there are 96 public schools in 34 school districts serving just over 24,000 students. Districts ranges in size from 115 students in Kelso C-7 to 3,353 students in Sikeston R-6.
In this profile, we also report district’s academic growth and achievement. Missouri has undergone multiple standards and testing changes over the last decade but has finally settled on a re-designed version of the MAP assessment that is based on state-designed learning standards. The first iteration of the new test was administered in the spring of 2018. Given that students were taking a new, more rigorous exam, these growth scores may not be as high as some had hoped. However, with some consistency in the test and standards used, we look forward to seeing more positive academic gains over the coming years.
Who are students in the Bootheel? Compared to the state, the Bootheel region serves a much larger population of Free/Reduced-Price Lunch (FRL) eligible students. In fact, nearly three-quarters of the students in the Bootheel receive free or reduced-price meals. The percentage of FRL-eligible students ranges from 40% in Kelso C-7 to 100% of students in multiple districts. Multiple districts in the region participate in the Community Eligibility Provision. Thus, these districts are shown to have 100% of students as FRL-eligible.

How much do districts spend? Districts in the region spend almost $1,000 more per student than the state average. This rHow much do districts spend? Districts in the region spend over $2,000 less per student than the state average. This ranges from $7,862 dollars per student in Oran R-III to $12,807 in Cooter R-IV.
On average, Missouri’s funds are split 47% local, 43% state, and 10% federal. Districts in the Bootheel generate their funds in a similar split with 42% of dollars coming from the local tax base. These local amounts range from 67% in New Madrid County R-I to 29% in Malden R-I, making them the most state-dependent of the region’s districts.

How much do teachers in the Bootheel make? The most important part of a district’s budget includes the amount paid to teachers. Here, we see rather large differences in the starting, average, and maximum salaries teachers can earn. New Madrid County R-I has the highest average salary among teachers in the region ($46,423), the highest starting salary is in North Pemiscot County R-I ($35,875), and the highest maximum salary is in Sikeston R-6 ($62,480). The lowest starting and average salary among Bootheel districts is in Clarkton C-4, where new teachers make $29,351 and the average salary is $33,480. The district with the lowest maximum salary is in Delta C-7 ($43,500).

How are students in the Bootheel doing? To measure school performance, we present multiple dimensions including percent of students scoring proficient and advanced (ready) on the state’s MAP assessment, average ACT Composite score, and graduation rate. The average graduation rate in the state is 89% and 94% for the region.
Multiple districts in the Bootheel have a 100% high school graduation rate. The lowest high school graduation rate is 76% in Clarkton C-4. Hayti R-II has the lowest reported average ACT Composite score at 15.2 out of 36 possible points. Gideon 37 has the highest average ACT score at 21.4.

2017-18 was first iteration of the state’s new test As a region, the percentage of students in the Bootheel scoring proficient and advanced on the English (43%) and Math (36%) assessments is slightly below the statewide averages (49% and 43%, respectively). For ELA, these percentages range from 28% proficient and advanced in Charleston R-I to 85% in Richland R-I. For math, these percentages range from 12% in Clarkton C-4 to 89% in Richland R-I. However, these simple percentages make it difficult to determine the year-to-year test score growth in each of these districts.
Preliminary descriptive analyses of these publicly-available data show predictable patterns in district performance. Unsurprisingly, we see a strong negative relationship between district performance and the number of FRL-eligible students enrolling. This negative relationship between student performance and student need is similar when examining average ACT scores and high school graduation rates.
Recently, the growth scores were reported for schools and districts across the state, allowing us to compare performance to previous years. For a fulle explanation of how growth scores in Missouri are calculated, you can read the Comprehensive Guide from DESE.
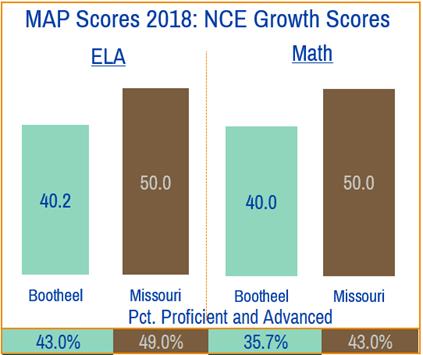
Growth scores are reported as Normal Curve Equivalent (NCE) units, which show how students perform to the expected growth. By construction, the state average expected growth is 50 NCE units. Therefore, a school or district with an average growth score of NCE units is performing as expected, whereas growth scores above 50 NCE units means schools are performing better than expected. We provide a full explanation of NCEs on page 5. Growth scores reflect how students how much schools are improving students earning over time and provides a more level comparison, as all students are evaluated by how much they grow compared to previous years. These growth scores are less related to student characteristics and therefore better reflect the impacts of schools than achievement levels.
Preliminary descriptive analyses of these publicly-available data show predictable patterns in district performance. Unsurprisingly, we see a strong negative relationship between district performance and the number of FRL-eligible students enrolling. This negative relationship between student performance and student need is similar when examining average ACT scores and high school graduation rates.
Another district characteristic having a negative impact on school performance is student mobility rate, defined as the percentage of students who change schools during the year. Districts with higher mobility rates have lower percentages of students who score at the ready level on both the English and Math MAP assessment, lower average ACT scores, and lower high school graduation rates. The connection is strongest between high mobility rates and low graduation rates, showing the importance of stability and consistency in where students learn helping students to learn.
It is important to note that this publication has only scratched the surface of what makes the education landscape in the Bootheel complex and interesting. Here, we have provided a view of only district characteristics using publicly available data, which tells a part of the story. As unique as each of the districts is in the Bootheel, it is also likely true that we would uncover even more interesting patterns and information for schools both within and across the districts. Along with being accessible on the Department of Elementary and Secondary Education’s data portal, we have made these data available on our website’s data portal. It is our hope that these profiles and downloadable datasets provide some useful information about education in the Bootheel and inform the conversation to ensure that each district is able to help all students in the region realize their full potential.
MORE FROM THE PRiME BLOGS


Free and Reduced-Price Lunch (FRL) can be a bit of a buzzword in the education space. In today’s blog post, we dispel common misconceptions about the program, and answer some FAQs.